At a glance
- What: a course exercise for a bike-share company that wants more riders on single-ride or day passes (the course calls them casual riders) to buy yearly memberships, asking how the two groups ride differently.
- My part: I did the analysis in R and wrote the report with recommendations; it was an individual course capstone.
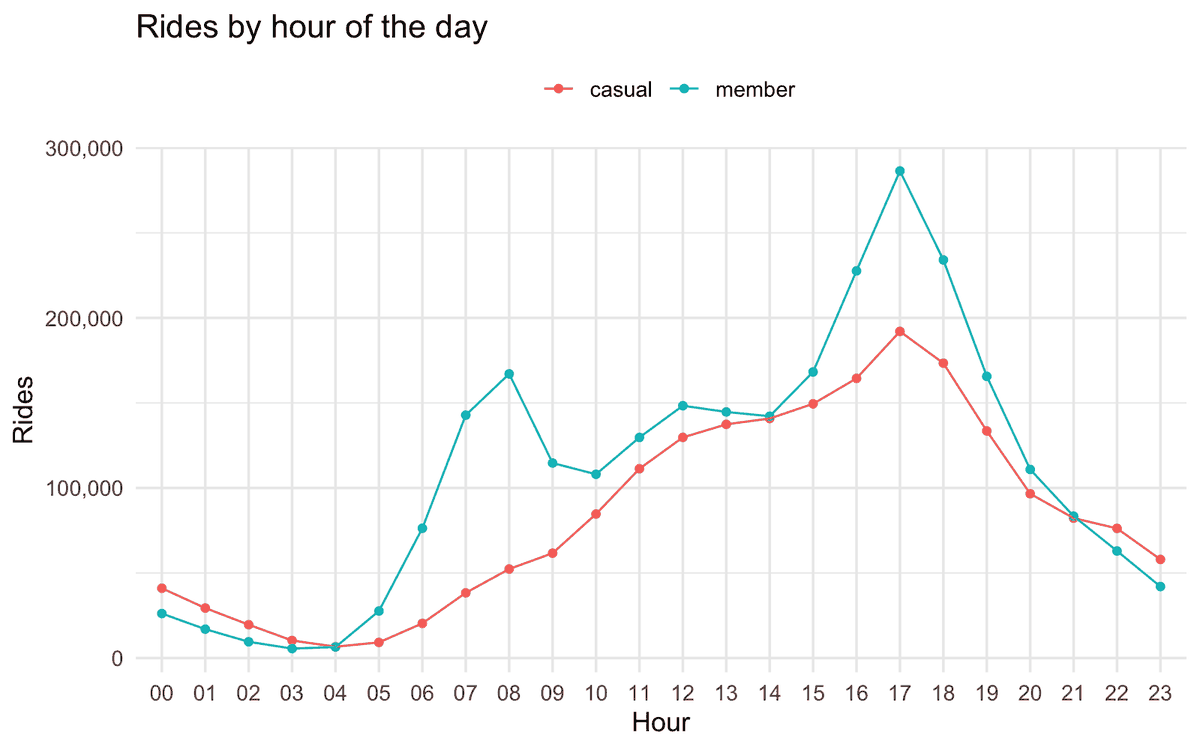
- Result: casual riders take longer rides, a median of 16 minutes against 9, and ride more at weekends; members ride more on weekdays, with a morning peak at 8 am.
The question
In the Google course case study, Cyclistic wants to turn more casual riders, who buy single-ride or day passes, into yearly members. The question was how the two groups use the bikes differently.
Data and method
I used twelve monthly trip files from Divvy, Chicago's bike-share system, from June 2021 to May 2022: 5,860,776 rides. In R I removed three kinds of ride: rides with a negative ride time, rides from two test or warehouse stations, and rides with any missing value. Almost all of the last kind were e-bike rides with no station recorded. That left 4,666,342 rides. I then compared the two groups by ride length, day, hour, month and route, and drew the charts with ggplot2.
What I found
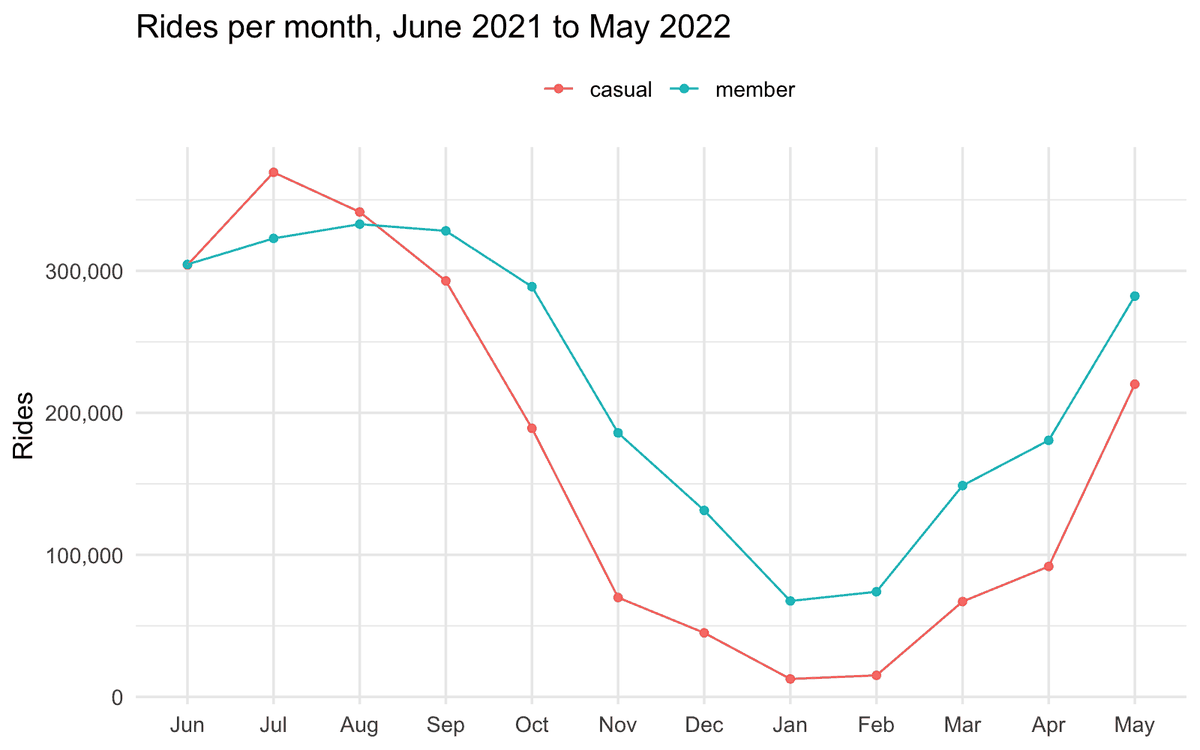
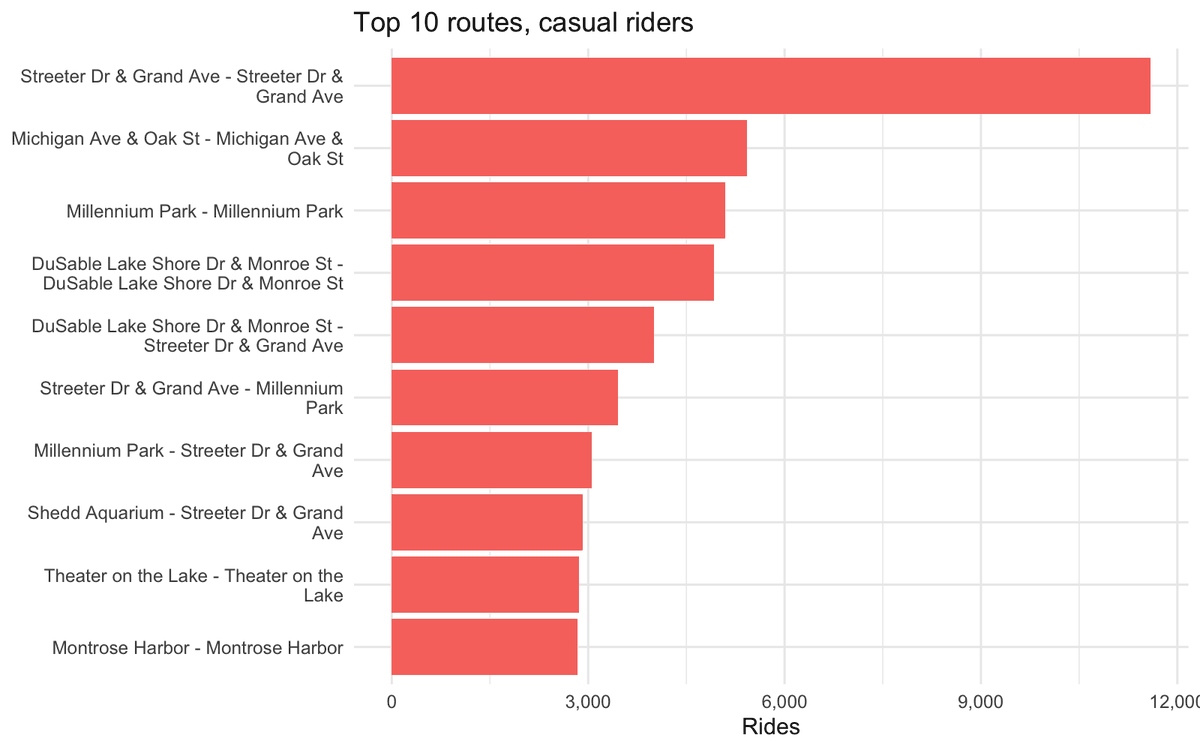
Of the rides kept, members took 57% and casual riders 43%. Casual rides ran longer: 8.9% lasted over an hour against 0.6% for members. They were also more often at weekends: 41% of casual rides against 25% of member rides. Round trips make up 6 of their top 10 routes, although only about 1 in 10 casual rides is a round trip. Members' morning peak at 8 am suggests many of them ride to work, and both groups ride far more in summer.
Recommendations
In my report I recommended putting more bikes and marketing on the routes casual riders use most, offering a weekend pass, selling passes by number of rides, such as 5 or 10, to regular casual riders, and running campaigns in the warmer months.
What I would do next
I would recommend better data collection, with fewer missing values, negative ride times and repair trips in the data. I would also use more than one year of data, and add surveys or interviews to learn what casual riders want.