At a glance
- What: a course exercise in predicting whether a Falcon 9 rocket's first stage will land. SpaceX lands and reuses that stage, which largely explains its lower prices, so the prediction could help a company bidding against SpaceX estimate what a launch costs.
- My part: I collected the launch data in the course's notebooks, writing the steps that request it, keep only Falcon 9 launches and fill in missing values. For the later steps I used files the course prepared: 90 launches for the charts and models, and separate files for the SQL queries, the map and the dashboard. It was an individual capstone.
- Result: all four models predicted 15 of 18 test launches correctly, against 12 for simply guessing that every first stage lands; I chose logistic regression as the simplest.
The question
Will a Falcon 9 first stage land? The course brief gave the reason it matters: SpaceX advertised launches at 62 million dollars while other providers charged upward of 165 million, largely because it lands and reuses the first stage.
Data and method
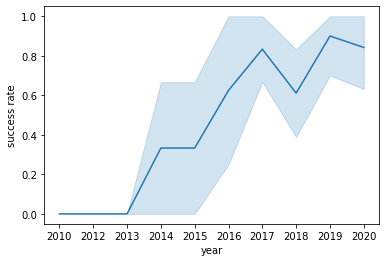
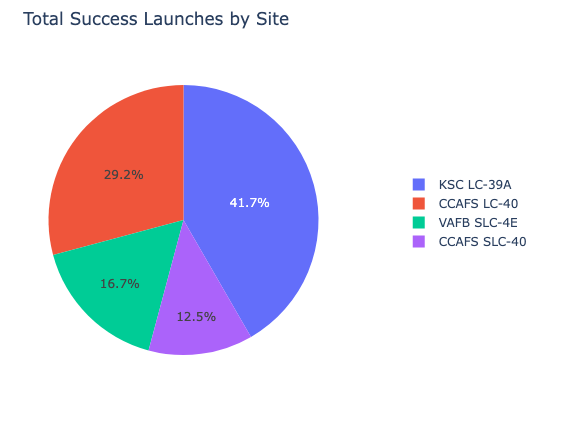
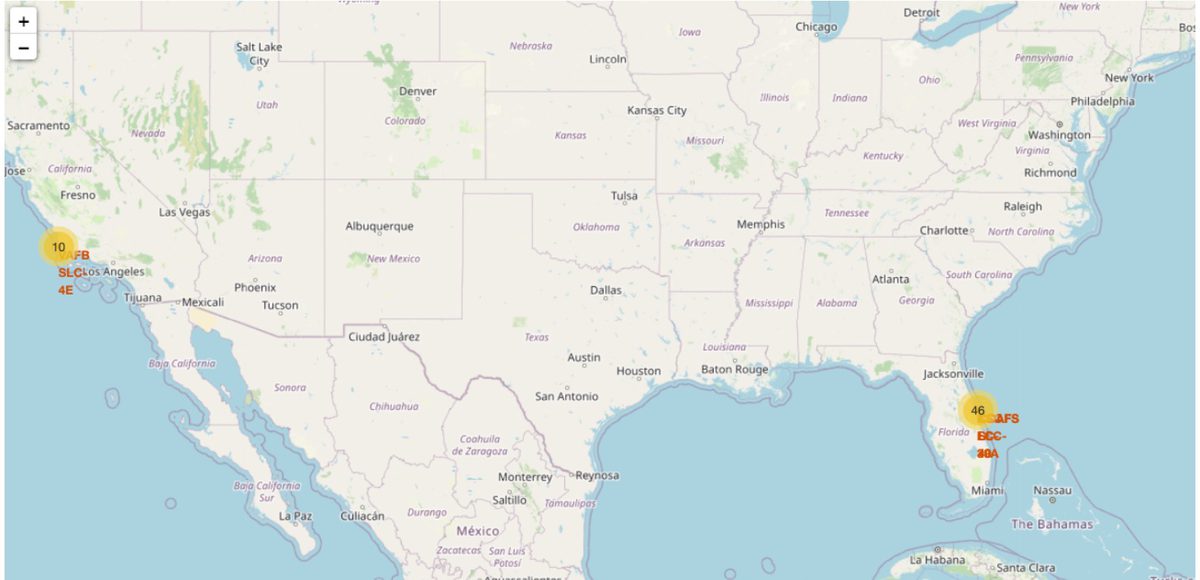
I collected launch records from SpaceX's public launch data service (an application programming interface, or API), using the course's helper code to turn its ID numbers into real values. I also scraped the Wikipedia list of Falcon 9 launches with BeautifulSoup. For the later steps the course supplied prepared files, including one of 90 Falcon 9 launches for the charts and models. I merged eight kinds of landing result into landed or not (60 of 90 landed). I then explored the data with charts and structured query language (SQL) queries, mapped the launch sites with Folium and built a Plotly Dash dashboard.
Results
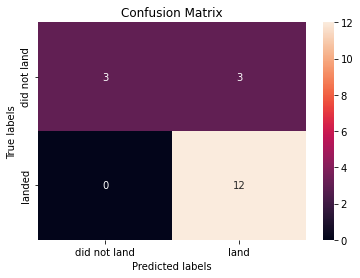
I compared four standard prediction models (logistic regression, a support vector machine, a decision tree and k-nearest neighbours), each tuned with a grid search. On the 18 launches held back for testing, all four got 15 right, against 12 for simply guessing that every first stage lands. Their cross-validation scores were too close to separate, so I chose the simplest, logistic regression. It predicted all 12 landings correctly, but it also predicted a landing for 3 of the 6 launches that did not land.
Dashboard and map
 (open the full-size image)
What I would do next
With only 18 test launches the models could not be told apart, so I would test them on more launches, including ones flown after this data was collected.